4 TikZ
TikZ 非常强大,远比 pgfplots 强大。你可以用它来干[任何画图相关的事。]^(画流程图,思维导图,海报或宣传手册,电路图乃至国旗。)尽管它的官方手册已经有了 1200 多页(2019 年), 但它的基础命令只有两个:\draw 和 \path, 后者配合 node 一起使用。
部分参考资料
Minimal introduction for Tikz: https://cremeronline.com/LaTeX/minimaltikz.pdf
Some basic economic diagrams: http://www.texample.net/tikz/examples/area/economics/
some economics diagram templates: https://sites.google.com/site/kochiuyu/Tikz
4.1 \draw
首先介绍\draw。注意每行命令末尾的冒号(semicolon).
4.1.1 画直线
\draw (1,0) -- (0,0) -- (0,1);
一个完整的回路可以用 --cycle 命令。
\draw[red, dashed, very thick, rotate=30] (1,0) -- (0,0) -- (0,1) -- cycle;
4.1.2 简单平滑曲线
简单平滑曲线由(至少)三个参数控制:起点,终点,和定位点。定位点决定曲线的“弯曲程度”。定位点可以有两个。
\draw[red]  (0,0) .. controls (1,1) .. (4,0);
\draw[blue] (0,0) .. controls (3,3) .. (4,0);
\draw       (0,0) .. controls (1,-1) and (2, 0) .. (4,0);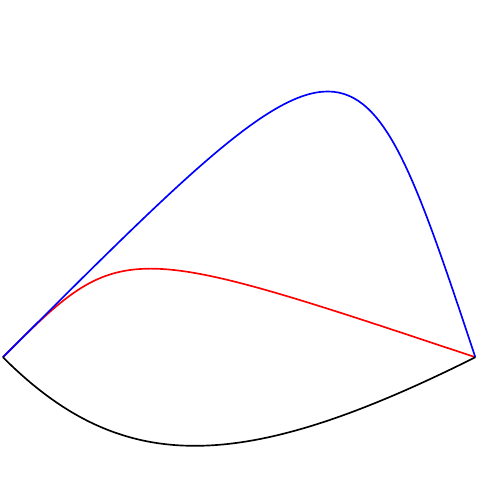
4.1.3 简单平滑曲线 II
可以设置开始和结束时的速度方向(to[out=90,in=180])或直接声明曲线向哪边弯曲(to[bend right])。
\draw[red]  (0,0) to (3,2);
\draw[blue] (0,0) to[out=90,in=180] (3,2);
\draw       (0,0) to[bend right] (3,2);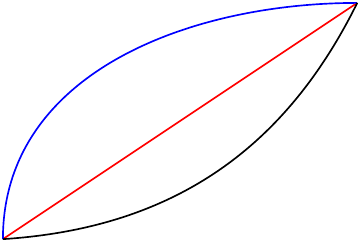
4.1.4 封闭图形
对常见封闭图形(矩形,圆,椭圆等)有特定语法。
rectangle和circle命令: 矩形和圆。
\draw[dotted] (0,0) rectangle (1,1);
\draw[red]  (0,0) circle [radius=1.5];
\draw[blue] (0,0) circle [x radius=1.5cm, y radius=10mm];
\draw       (0,0) circle [x radius=1cm, y radius=5mm, rotate=30];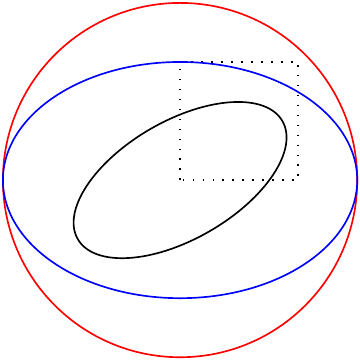
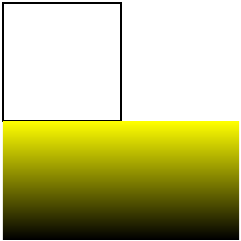
4.1.5 填色
我们可以用\shade或\filldraw对封闭图形填色。
\draw (0,0) rectangle (1,1);
\shade[top color=yellow, bottom color=black] (0,0) rectangle (2,-1);
\filldraw[fill=green!20!white, draw=green!40!black] (0,0) rectangle (2,1);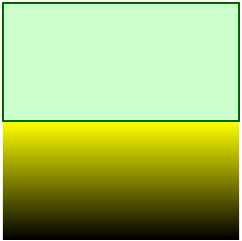
Fillcolor green!20!white表示 20% 的绿混合 80% 的白。
注:细心的读者可能注意到,\filldraw命令把开始的\draw给覆盖了。事实上,如果我们注释掉\filldraw命令,结果如下。
4.1.6 (椭)圆弧
\draw (x,y) arc (start:stop:radius); draws an arc that
starts from
(x,y)with radius
radiuswith center
(x-r*cos(start), y-r*sin(start))andends at
(x-r*cos(start)+r*cos(stop), y-r*sin(start)+r*sin(stop)).
举个例子,\draw[red] (0,0) arc (30:60:3);表示这样一个圆弧:
半径为 3
从
(0,0)开始圆心
(0+3*cos(30+180),0+3*sin(30+180))在
(0+3*cos(30+180)+3*cos(60),0+3*sin(30+180)+3*sin(60))结束
\begin{tikzpicture}
\draw (0,0) arc (0:270:8mm);
\end{tikzpicture}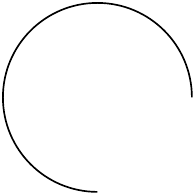
\begin{tikzpicture}
\draw (0,0) arc (0:270:8mm);
\end{tikzpicture}
arc 可以和 to(--)联合使用。

我一直没有弄懂 arc的参数到底画出什么样的曲线。总是先画了看看再调整。
4.2 \path
接下来介绍 TikZ 第二大命令\path,它通常和node一起使用。
4.2.1 node
命令 node 表示一个附带文字 的几何形状。有时它就表示放在某个位置的文字。比如
\path (0,0) node {Here I am.};它表示在(0,0)点处写一句“Here I am.”
node的完整命令如下:
(a,b) node[<options>](<name>){<text>}<options>:相对(a,b)的位置,形状,颜色等。<name>:一个 optional 的命令,给这个 node 取个名字方便以后引用。<text>:要写的话。
例1
\fill[fill=yellow]
    (0,0) node {1st node}
 -- (1,1) node[circle,inner sep=0pt,draw] {2nd node}
 -- (0,2) node[fill=red!20,draw,double,rounded corners] {3rd node};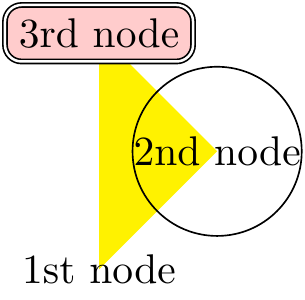
例2
\path (0,0) node(x)              {Hello World!}
      (3,1) node[circle,draw](y) {$\int_1^2 x \mathrm d x$};
\draw[->,blue] (x) -- (y);
\draw[->,red] (x) -| node[near start,below] {label} (y);
\draw[->,orange] (x) .. controls +(up:1cm) and +(left:1cm) .. node[above,sloped] {label} (y);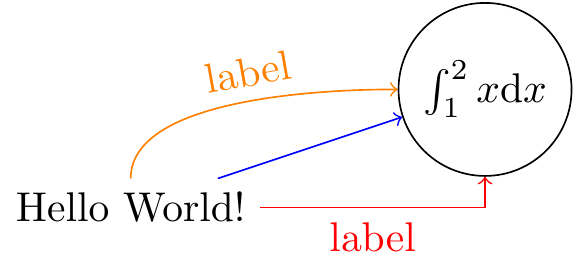
当我们使用 \draw 连接 node时,轨迹会很“聪明”地避开node.
这个例子使用了 TikZ的常见套路:先用\path定义节点node,再用\draw在节点之间连线。
4.2.2 循环
是的,我们可以用循环来绘图。见如下例子:
\foreach \x in {0,...,9}
  \draw (\x,0) circle (0.4);
\foreach: 使用 for 循环\x: 循环变量{0,...,9}: 用于循环的集合
由于 node 除了位置还有 text 属性,我们允许有两个循环变量:\x/\xtext. 如下例:
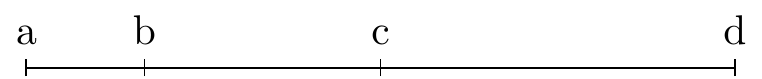
\draw (0,0) -- (6,0);
\foreach \x/\xtext in {0/a,1/b,3/c,6/d}{
  \draw (\x cm,-2pt) -- (\x cm,2pt) node[above] {\xtext};
  }
4.2.3 函数图像
PGF 本身的 plot命令可以绘制函数图像。pdfplots 包的\addplot 命令是plot的一个 wrapper.
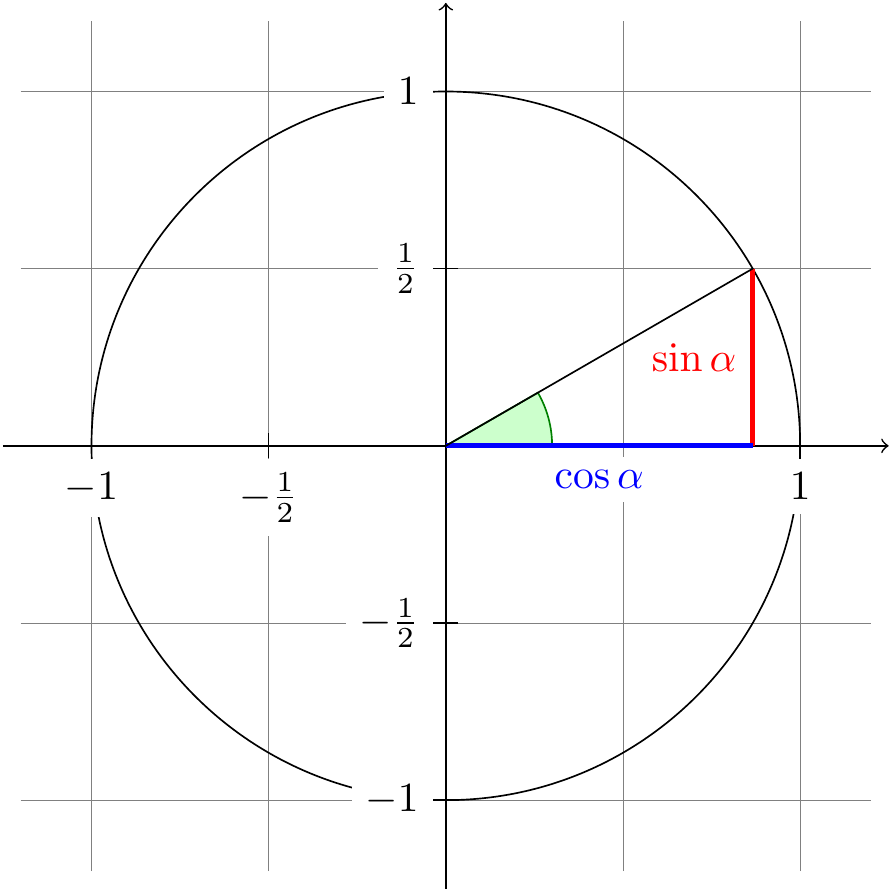
\begin{tikzpicture}[scale=3]
 \draw[step=.5cm, gray, very thin] (-1.2,-1.2) grid (1.2,1.2);
 \filldraw[fill=green!20,draw=green!50!black] (0,0) -- (3mm,0mm) arc (0:30:3mm) -- cycle;
 \draw[->] (-1.25,0) -- (1.25,0) coordinate (x axis);
 \draw[->] (0,-1.25) -- (0,1.25) coordinate (y axis);
 \draw (0,0) circle (1cm);
 \draw[very thick,red] (30:1cm) -- node[left,fill=white] {$\sin \alpha$} (30:1cm |- x axis);
 \draw[very thick,blue] (30:1cm |- x axis) -- node[below=2pt,fill=white] {$\cos \alpha$} (0,0);
 \draw (0,0) -- (30:1cm);
 \foreach \x/\xtext in {-1, -0.5/-\frac{1}{2}, 1}
   \draw (\x cm,1pt) -- (\x cm,-1pt) node[anchor=north,fill=white] {$\xtext$};
 \foreach \y/\ytext in {-1, -0.5/-\frac{1}{2}, 0.5/\frac{1}{2}, 1}
   \draw (1pt,\y cm) -- (-1pt,\y cm) node[anchor=east,fill=white] {$\ytext$};
 \end{tikzpicture}